We thought about our favourite colours and then did a bar graph to show which colour was liked most, and which colour was least like.

This is what we found:


Next, we did our own bar graphs. We looked at our timetable and put the different activities that we do at school in order. We also thought about the clothes we wear when it is hot, cool or cold, and we put the pictures of clothes in the correct columns. Have a look at our photo:


Next we thought about our favourite toys, and then did a bar graph to show which toys were most liked, and which toys were least like

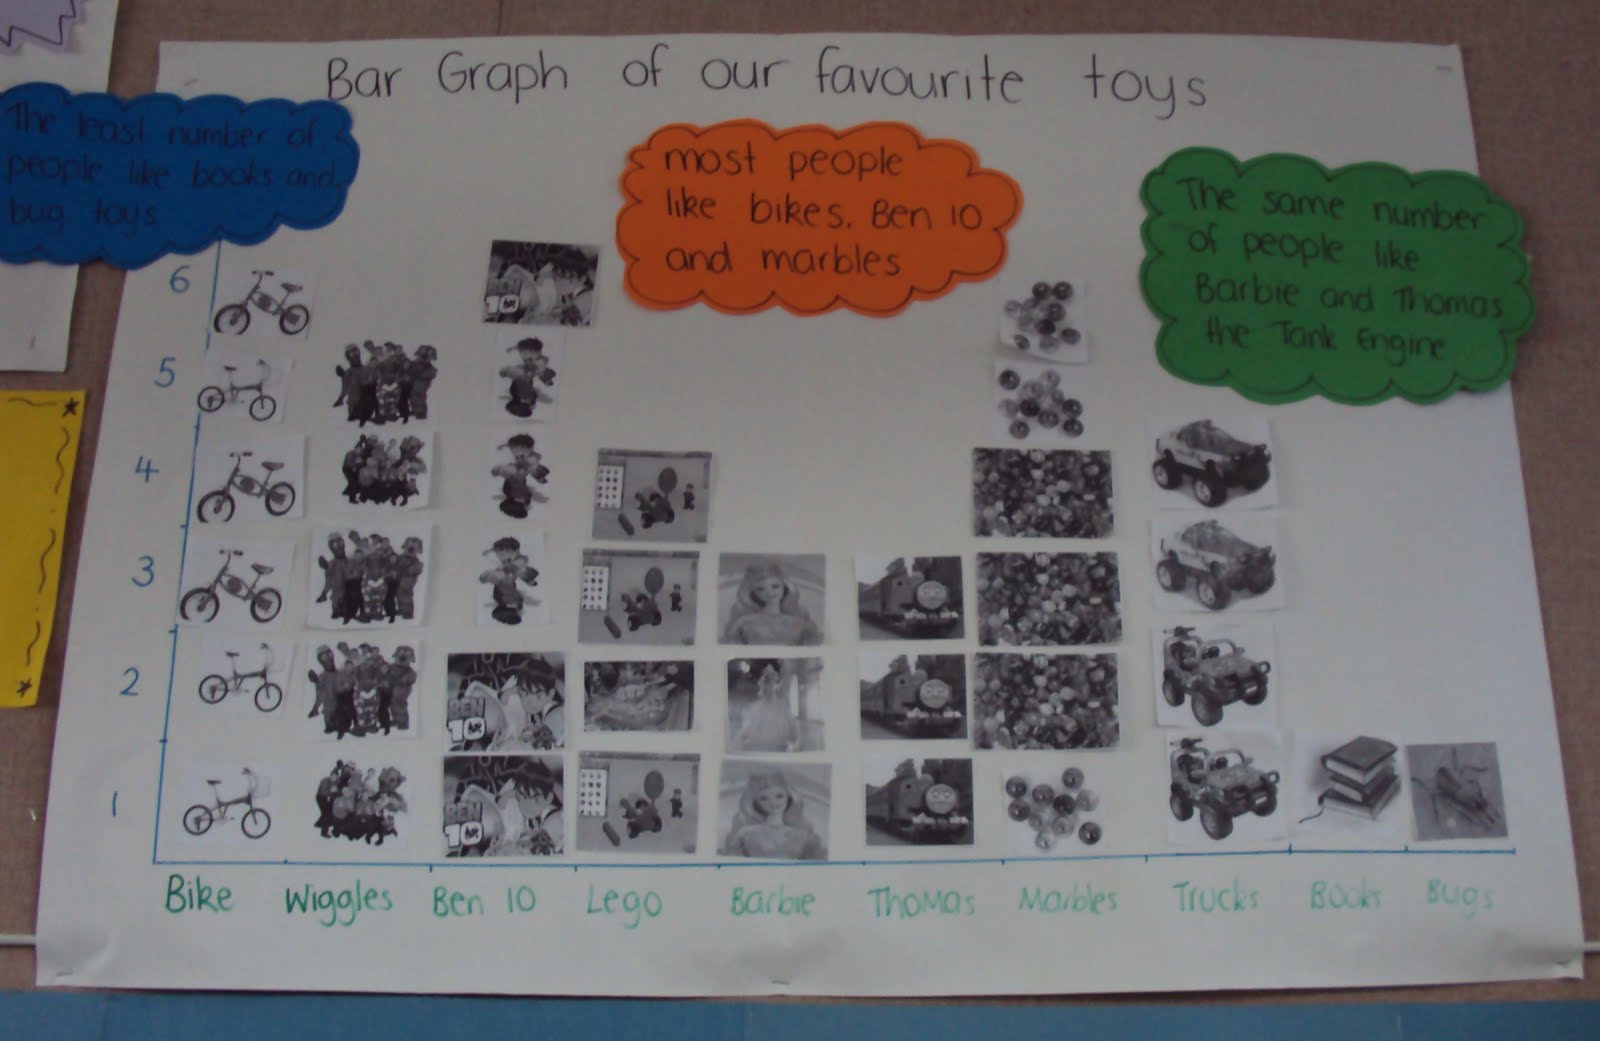
This is what we found:


Next, we did our own bar graphs. We looked at our timetable and put the different activities that we do at school in order. We also thought about the clothes we wear when it is hot, cool or cold, and we put the pictures of clothes in the correct columns. Have a look at our photo:


No comments:
Post a Comment